- Published on
Service Level Objectives with Linkerd and Google Cloud Monitoring / Operations Suite
- Authors

- Name
- Oden SRE Team
- @oden_tech
Service Level Objectives with Linkerd and Google Cloud Monitoring
Oden Technologies is in the business of ingesting, analyzing and creating useful signals from a nonstop tidal wave of machine data from our customers' factories, 24 hours a day, and we do so using an entirely cloud-native architecture.
Both the fun and challenging part of building a cloud-native system is that there are a plethora, nay, a cornucopia of tools available to let you do it. So many, in fact, that half the job of being an Infrastructure or Site Reliablity Engineer at just about any company is figuring out how to make the many and varied tools from different vendors and open-source projects play nicely together!
Such was one of our challenges at Oden two years ago: we were sold on moving our workload management to Kubernetes using Google Kubernetes Engine to abstract away the heavy lifting of building and managing Kubernetes clusters.
We also knew that we wanted to use a "Kubernetes Service Mesh" to provide better internal traffic management and, importantly, reporting and monitoring information than the native Kubernetes tools.
And lastly and most importantly: we wanted to be sure that the whole shebang worked and provided a fast and reliable experience for our customers! Which meant that we wanted to monitor our services using Service Level Objectives, and track our adherence to those SLOs using familiar tools.
The good news was: we found a service mesh (Linkerd) that we really liked (and continue to like!) and was easy to deploy. And it includes a built-in monitoring system based on Prometheus that tracks latency and availability data not only on a per-service but even on a per-API level.
Further good news: Google's Cloud Platform already has a built in SLO Monitoring feature, all set up and ready to stick data into!
The bad news was: there was no built-in way to export that data from Linkerd's prometheus instance into Google Cloud Monitoring, which meant that Google's SLO Monitoring had no data to look at.
Here's how we solved it.
Background: SLOs, SLIs and Service Meshes, oh my!
There's been a lot of ink spilled on these topics in the past few years, and a thorough rehash would make this already verbose post substantially longer, but a quick review:
-
A Service Level Objective is, essentially, a performance target that hopefully reflects the experience of your customers using your product. For example: "the 99th percentile response time for any request to our query APIs should not exceed 20 seconds for more than ten minutes per week." The goal of a SLO is to allow you to respond to incidents that are harming the customer experience, rather than just arbitrary metrics like "the CPU on the database is really busy."
-
A Service Level Indicator is the data that you use to evaluate whether you are passing or failing your SLO at any given moment. For example, a metric timeseries in Google Cloud Monitoring.
-
A Service Mesh is an application-layer traffic routing system for Kubernetes Clusters: in practice this means that each instance of your application(s) gets a dedicated layer-7 proxy attached to it, and that those proxies report back to and receive routing directions from a control plane.
This article also assumes at least passing familiarity with installing and configuring the Linkerd service mesh specifically. If you've never done that before, we recommend their excellent Getting Started Guide and also their guide to Installing Linkerd with Helm.
If this is all gibberish to you, we recommend some background reading:
- SLOs and SLIs:
- Service Level Objectives from the Google SRE Book
- SRE fundamentals 2021: SLIs vs SLAs vs SLOs from the Google Cloud Blog
- SLO vs SLA: What's the Difference and How Does SLI Relate? from The New Stack
- What's the difference between SLI, SLA and SLO? from devops.com
- Service Meshes:
- What is a service mesh? from the linkerd.io documentation
- The Service Mesh: what every software engineer needs to know about the world's most over-hyped technology
Step One: Exporting data from Linkerd to Google Cloud Monitoring
Google's engineering team provide a stackdriver-prometheus-sidecar tool that directly reads the Prometheus write-ahead log and forwards selected metrics to Google Cloud Monitoring (formerly known as Stackdriver). With a bit of elbow grease, you can use it to get many of Linkerd's internal metrics visible in Google Cloud Monitoring, from whence you can feed them into Google SLO Monitoring.
Unfortunately, a set of interlocking limitations in both the sidecar tool and the Google Cloud Monitoring API make this somewhat less than a plug-and-play process:
- While the sidecar can directly translate and forward Prometheus histogram metrics to GCM distribution metrics, the number of labels that Linkerd adds to its Prometheus metrics is much larger than the maximum number of labels permitted by the Google Cloud Monitoring API, and it currently does not support forwarding non-gauge recorded metrics. So if you want to, for example, track the the 50th and 90th percentile latencies for a linkerd service, you will need to set up Prometheus recording rules to extract the metrics from the histogram using the histogram_quantile function and filter out some extraneous metadata.
- the sidecar requires that you use the default naming
format
when defining recording rules, e.g.
linkerd_job:svc_latency_ms:p50_30s - But, huge catch: colon (
:) characters are not valid in Google Cloud Monitoring metric descriptors, so you need to use the sidecar's ability to rename metrics en route to Google.
Luckily all of these issues can be dealt with, they just require that there be a number of moving parts in play. (Well, and it also required that we pitch in and help fix one of the longest standing open bugs in the stackdriver-prometheus-sidecard project. Getting to help improve the ecosystem is a fringe benefit of working at Oden!)
(Note: The instructions from here on in assume that you are using helm to install linkerd-viz; if you are using Kustomize it should be reasonably straightforward to produce a similar result.)
Create the sidecar container
Google does not provide a public docker image for the sidecar, so you will need to build your own. Luckily, it's reasonably straightforward:
ARG GO_VERSION=1.17
FROM golang:${GO_VERSION} as build
ARG SIDECAR_VERSION=0.10.1
WORKDIR /src
RUN git clone https://github.com/Stackdriver/stackdriver-prometheus-sidecar.git
WORKDIR /src/stackdriver-prometheus-sidecar
RUN git checkout $SIDECAR_VERSION
RUN make build
ARG RUN_IMAGE_BASE="gcr.io/distroless/static:latest"
FROM $RUN_IMAGE_BASE
COPY /src/stackdriver-prometheus-sidecar/stackdriver-prometheus-sidecar /bin/stackdriver-prometheus-sidecar
EXPOSE 9091
ENTRYPOINT ["/bin/stackdriver-prometheus-sidecar"]
(Note that when you are initially installing and debugging, it might be
helpful to set RUN_IMAGE_BASE to something with a shell, e.g. alpine
or busybox.)
Build and push that image to your project's Google Container
Registry e.g.
gcr.io/${GCP_PROJECT}/stackdriver-prometheus-sidecar:0.10.1.
Once you've got the container available, you need to set it up to run alongside
the linkerd-prometheus container in the linkerd-viz namespace. Happily,
the Helm chart for linkerd-viz
has a section specifically for this purpose: prometheus.sidecarContainers. But
first, we need to set up a few other pieces:
Create a recording_rules.yml as a configmap
This is the file where we will extract simple gauge metrics from the histograms that Linkerd uses to store service latency data.
Note that in this example we are creating four gauge metrics: the 50th and 99th percentile, as averaged over 30 and 300 seconds. Depending on your particular needs you may want to adjust this.
apiVersion: v1
kind: ConfigMap
metadata:
  name: linkerd-prometheus-recording-rules
  namespace: linkerd-viz
data:
  recording_rules.yml: |
    groups:
    - name: service_aggregations
      rules:
      # warning: you _must_ export minimally an 'instance' and 'job' label, otherwise the
      # sidecar will drop it on the floor; see long and ugly discussion culminating at
      # https://github.com/Stackdriver/stackdriver-prometheus-sidecar/issues/104#issuecomment-529595575
      - record: linkerd_job:svc_response_rate_30s:sum
        expr: sum(rate(response_total{namespace="default", direction="outbound", dst_service=~".+", status_code=~".+"}[30s])) by (dst_service, instance, job, status_code)
      - record: linkerd_job:svc_latency_ms:p50_30s
        expr: histogram_quantile(0.50, sum(rate(response_latency_ms_bucket{namespace="default", direction="outbound", dst_service=~".+"}[30s])) by (le, dst_service, instance, job))
      - record: linkerd_job:svc_latency_ms:p99_30s
        expr: histogram_quantile(0.99, sum(rate(response_latency_ms_bucket{namespace="default", direction="outbound", dst_service=~".+"}[30s])) by (le, dst_service, instance, job))
      - record: linkerd_job:svc_latency_ms:p50_300s
        expr: histogram_quantile(0.50, sum(rate(response_latency_ms_bucket{namespace="default", direction="outbound", dst_service=~".+"}[300s])) by (le, dst_service, instance, job))
      - record: linkerd_job:svc_latency_ms:p99_300s
        expr: histogram_quantile(0.99, sum(rate(response_latency_ms_bucket{namespace="default", direction="outbound", dst_service=~".+"}[300s])) by (le, dst_service, instance, job))
      # warning: because we are exporting a COUNTER metric here, you _must_ sum by all
      # fields that, if they change, implicitly reset the counter (although you can elide
      # fields which change in lockstep e.g. "pod_template_hash" with "pod"), otherwise you will
      # export a "counter" that potentially resets to random numbers: stackdriver will sorta cope
      # but Service Monitoring will have a cow.
      - record: linkerd_job:response_total:sum
        expr: sum(response_total{namespace="default", direction="inbound"}) by (app, pod, instance, job, classification, status_code)
Unfortunately at this time the Linkerd helm chart does not have a space to define arbitrary configmaps; you'll need to install this manually or with whatever local tooling you use to manage such things.
Create a sidecar.yml as a configmap
sidecar.yml is the configuration
file for
the sidecar process: you use it to rename metrics and to statically set metric
types when necessary.
Note that here is where we rename our Prometheus recorded metrics from the
Prometheus-style level:metric:operations format that the sidecar requires, to
a value that Google Cloud Monitoring will accept as a valid metric
name.
apiVersion: v1
kind: ConfigMap
metadata:
  name: linkerd-prometheus-sidecar-config
  namespace: linkerd-viz
data:
  sidecar.yml: |
    #
    # this is the configuration file for the stackdriver-prometheus-sidecar container:
    # https://github.com/Stackdriver/stackdriver-prometheus-sidecar#file
    #
    # rename all recorded metrics to valid GCM metric descriptors
    metric_renames:
    - from: linkerd_job:svc_response_rate_30s:sum
      to: recorded_svc_response_rate_30s
    - from: linkerd_job:svc_latency_ms:p50_30s
      to: recorded_svc_latency_ms_p50_30s
    - from: linkerd_job:svc_latency_ms:p99_30s
      to: recorded_svc_latency_ms_p99_30s
    - from: linkerd_job:svc_latency_ms:p50_300s
      to: recorded_svc_latency_ms_p50_300s
    - from: linkerd_job:svc_latency_ms:p99_300s
      to: recorded_svc_latency_ms_p99_300s
    - from: linkerd_job:response_total:sum
      to: recorded_svc_response_cumulative
    # force the export of our recorded Prometheus COUNTER metrics
    # as GCM CUMULATIVE metrics with a `double` value. (This does not
    # seem to reliably happen automatically.)
    static_metadata:
    - metric: recorded_svc_response_cumulative
      type: counter
      value_type: double
      help: aggregated response totals to each linkerd service
    - metric: linkerd_job:response_total:sum
      type: counter
      value_type: double
      help: aggregated response totals to each linkerd service
Add the sidecar and the configmaps to the linkerd-prometheus pod
You can do this using the ruleConfigMapMounts and sidecarContainers
sections of the
values.yaml
for the linkerd-viz chart:
IMPORTANT -- take careful note of the --include flag that is the last
option to the sidecar command. This is where you specify a regular expression
that determines which prometheus metrics we are going to forward to Google
Cloud Monitoring. In this example we are forwarding only the metrics from
our-recording-rules.-You-may-wish-to-forward-others,
but-be-aware-of-the-limitations-noted-above.
prometheus:
  ruleConfigMapMounts:
  - name: "recording-rules"
    subPath: "recording_rules.yml"
    configMap: "linkerd-prometheus-recording-rules"
  - name: "sidecar-config"
    subPath: "sidecar.yml"
    configMap: "linkerd-prometheus-sidecar-config"
  sidecarContainers:
  - name: stackdriver-prometheus-sidecar
    image: gcr.io/<MY_PROJECT_ID>/stackdriver-prometheus-sidecar:0.10.1
    imagePullPolicy: always
    terminationMessagePath: /dev/termination.log
    terminationMessagePolicy: File
    volumeMounts:
    - name: "data"
      mountPath: "/data"
    - name: "sidecar-config"
      mountPath: "/etc/sidecar.yml"
      subPath: "sidecar.yml"
      readOnly: true
    command:
    - "/bin/stackdriver-prometheus-sidecar"
    - "--config-file=/etc/sidecar.yml"
    - "--stackdriver.project-id=<MY_PROJECT_ID>",
    - "--stackdriver.kubernetes.location=<MY_CLUSTER_REGION>",
    - "--stackdriver.kubernetes.cluster-name=<MY_CLUSTER_NAME>",
    - "--prometheus.wal-directory=/data/wal",
    - "--include={__name__=~\"^linkerd_job.+\"}"
With this in place, use helm to install or update the linkerd-viz chart. Afterward, you should see the sidecar container running inside the linkerd-prometheus pod:
$ kubectl -n linkerd-viz get \
  $(kubectl -n linkerd-viz get pod -l component=prometheus -o name) \
  -o=jsonpath='{.spec.containers[*].name}'
sidecar prometheus linkerd-proxy
The logs of the sidecar container should indicate that it started up correctly:
$ kubectl -n linkerd-viz logs \
  -f $(kubectl -n linkerd-viz get pod -l component=prometheus -o name) \
  sidecar
level=info ts=2022-05-11T18:04:13.241Z caller=main.go:293 msg="Starting Stackdriver Prometheus sidecar" version="(version=0.10.1, branch=master, revision=c71f5bff8cb6f26b5f72ac751b68c993a79f0dbd)"
level=info ts=2022-05-11T18:04:13.241Z caller=main.go:294 build_context="(go=go1.17.5, user=n@invidious.local, date=20211227-20:58:03)"
level=info ts=2022-05-11T18:04:13.241Z caller=main.go:295 host_details="(Linux 5.4.170+ #1 SMP Sat Feb 26 10:02:52 PST 2022 x86_64 prometheus-857fcbbf8c-kd5x9 (none))"
level=info ts=2022-05-11T18:04:13.241Z caller=main.go:296 fd_limits="(soft=1048576, hard=1048576)"
level=info ts=2022-05-11T18:04:13.249Z caller=main.go:598 msg="Web server started"
level=info ts=2022-05-11T18:04:13.249Z caller=main.go:579 msg="Stackdriver client started"
level=info ts=2022-05-11T18:05:16.258Z caller=manager.go:153 component="Prometheus reader" msg="Starting Prometheus reader..."
level=info ts=2022-05-11T18:05:16.276Z caller=manager.go:215 component="Prometheus reader" msg="reached first record after start offset" start_offset=0 skipped_records=0
...and within 3-5 minutes you should be able to find the metrics in Google
Cloud Monitoring with a Metric
Type
of e.g., external.googleapis.com/prometheus/recorded_svc_latency_ms_p99_30s
and a Resource
Type of
k8s_container.
Step Two: Set up your first SLO
Once data is streaming in to Google Cloud Monitoring, you can use it to set up an SLO and an alerting policy!
For example, let's say that we want to create a Service Level Objective that says: over 7 days, the 99th percentile latency for our "auth" service should not exceed 1 second for more than 1% of any given five minute period.
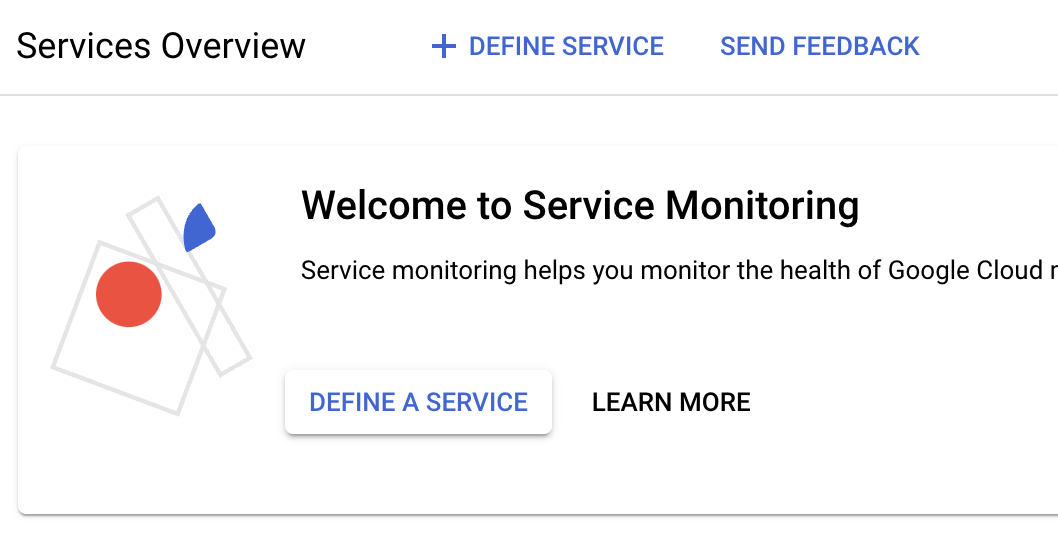
First, you have to define a service in Google SLO Monitoring:
- Go to the Google Service Monitoring Console
-
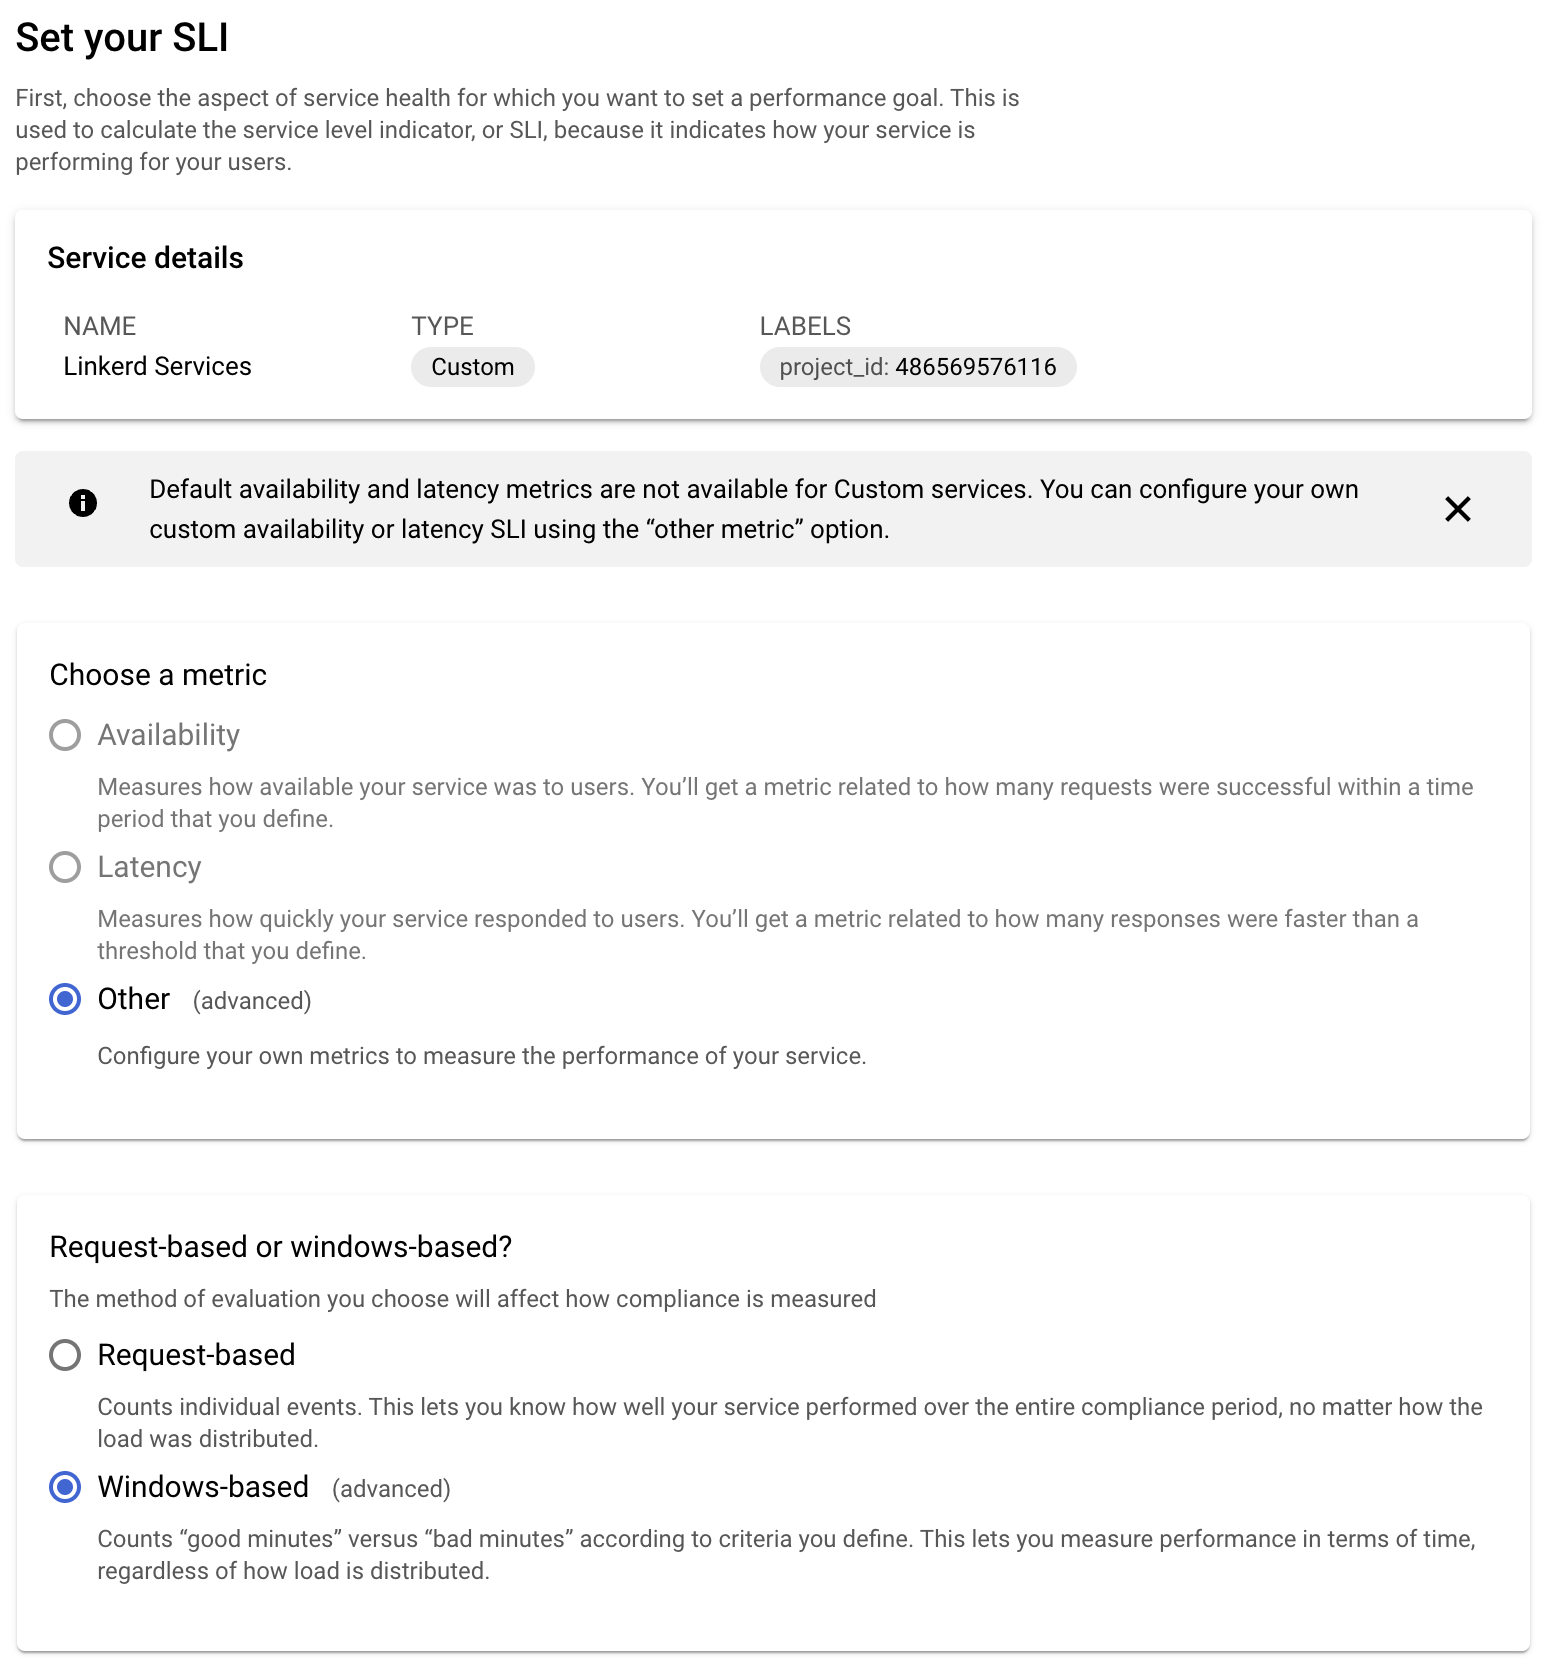
Once the custom service is created, click the "Create an SLO" button! There are four steps to creating an SLO:
-
Set up the SLI. Since we're creating the SLI based on the custom metric that we've exported from Linkerd to Google Cloud Monitoring you'll be using a custom metric, and we'll use the window-based measuring strategy:
-
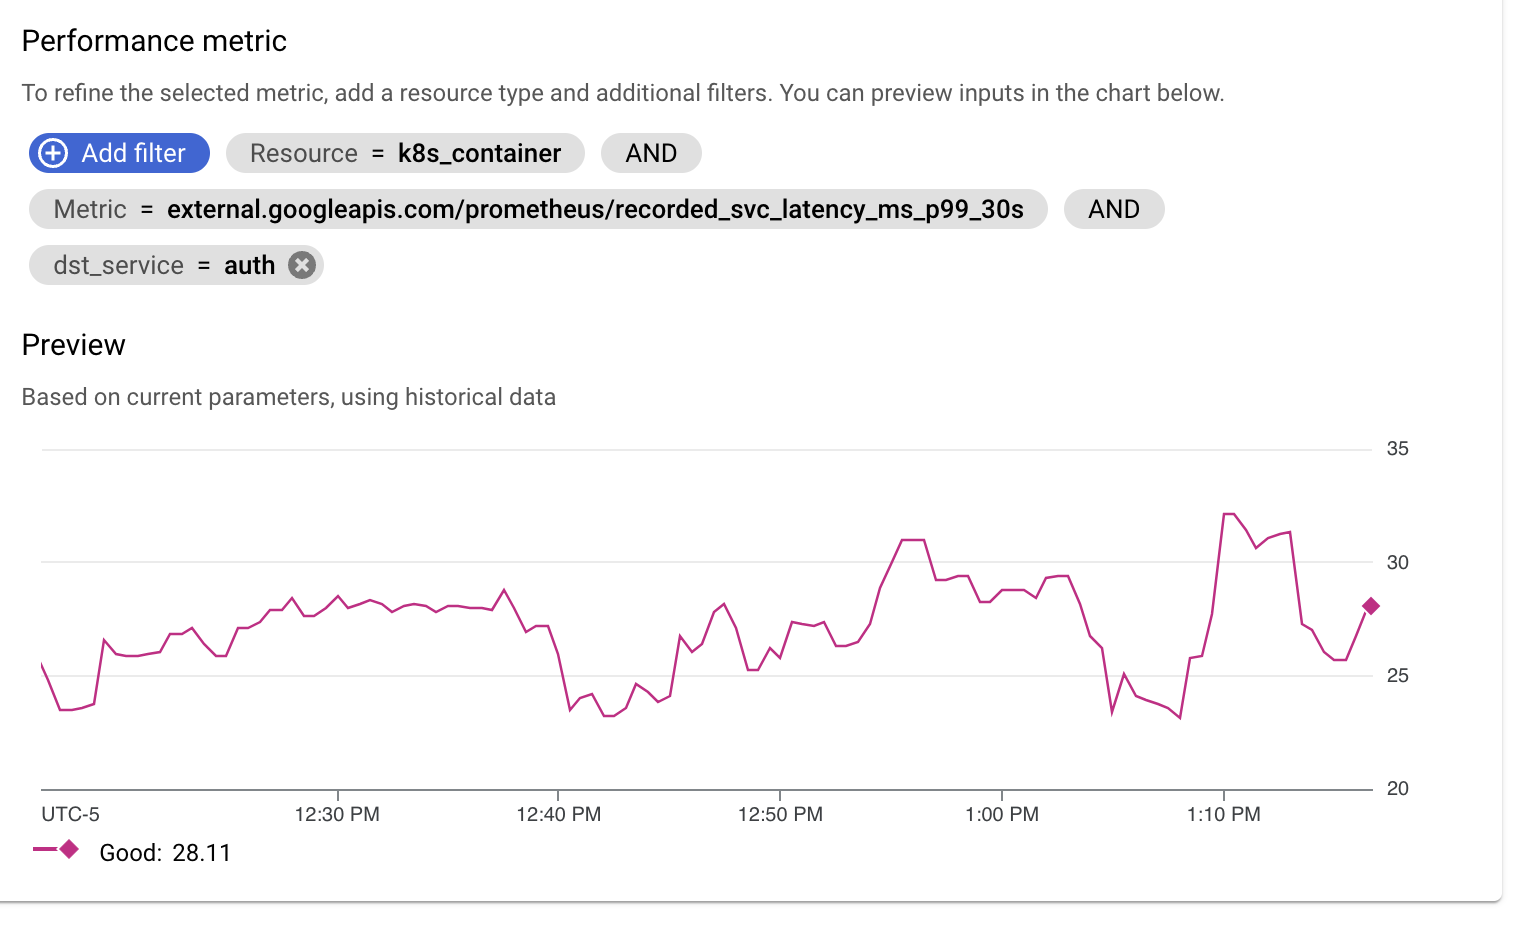
Attach our custom metric as the performance metric for the SLI:
a. Start typing
prometheus/recorded_svc_into the autosuggest box, and you'll see our custom metrics pop up as suggestions: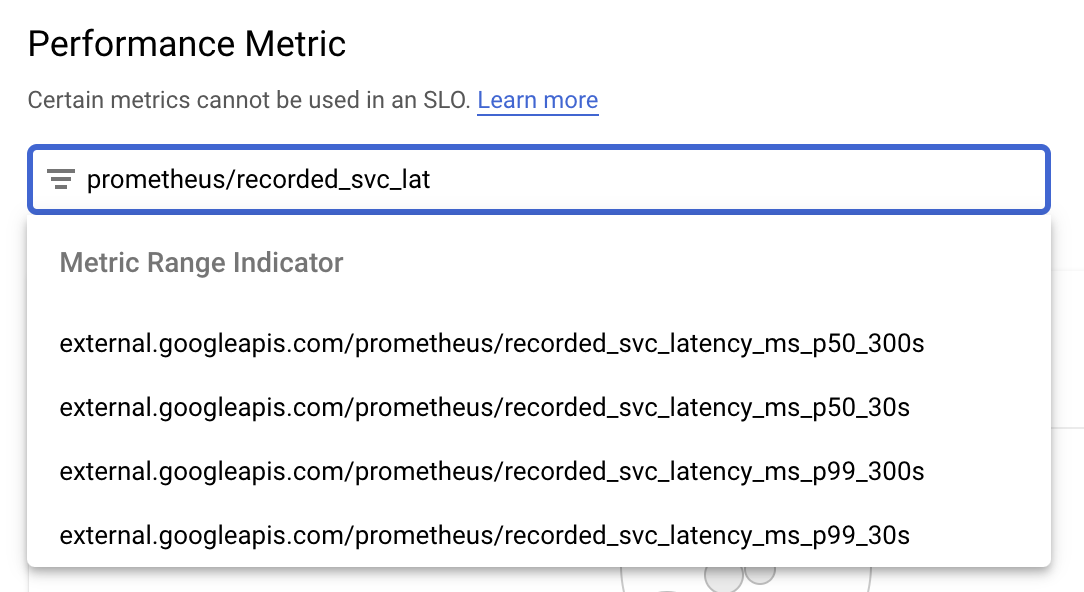
b. Pick the
recorded_svc_latency_ms_p99_30smetric: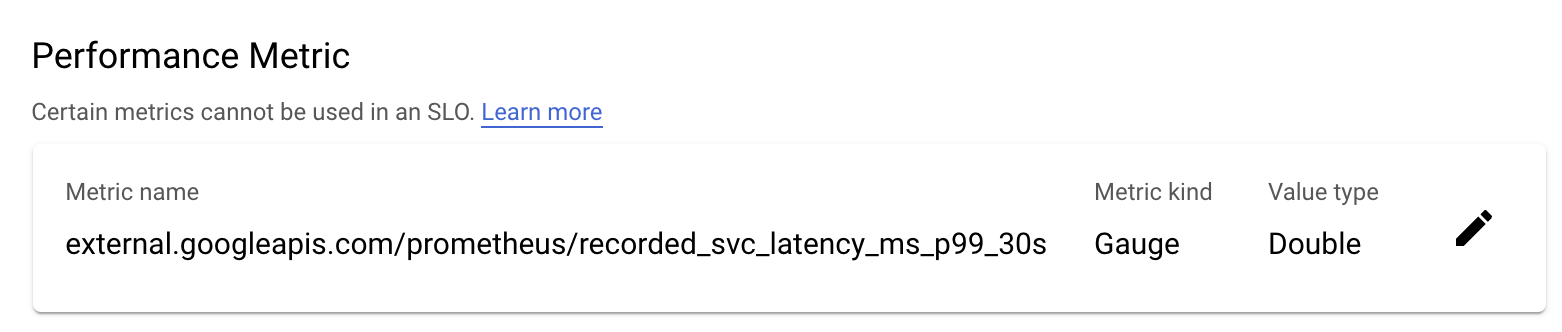
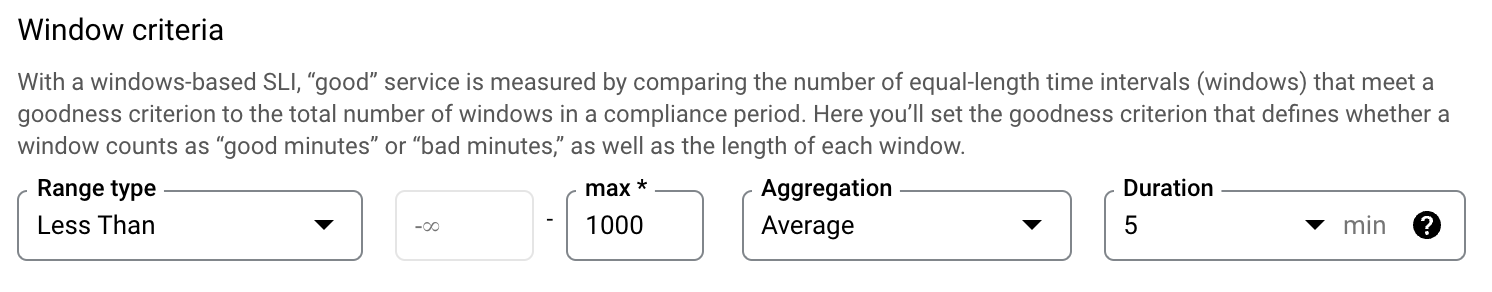
c. Set your window ranges: we want the average latency to be under 1000ms in every 5 minute window:
d. Add a filter so that we're only looking at the "auth" service. Linkerd adds a
dst_servicelabel to all metrics so we use that: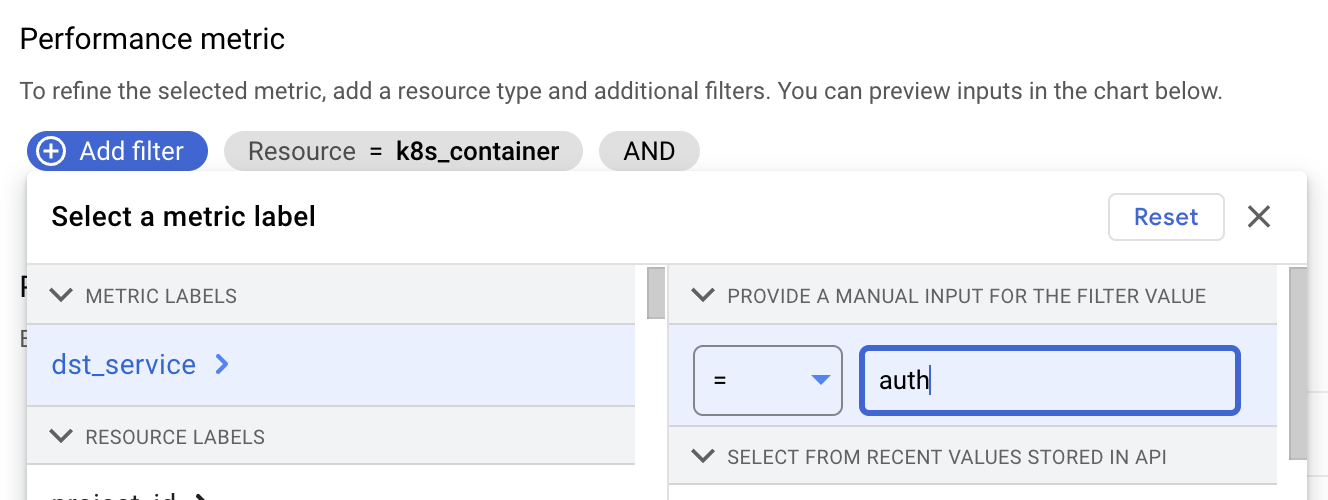
-
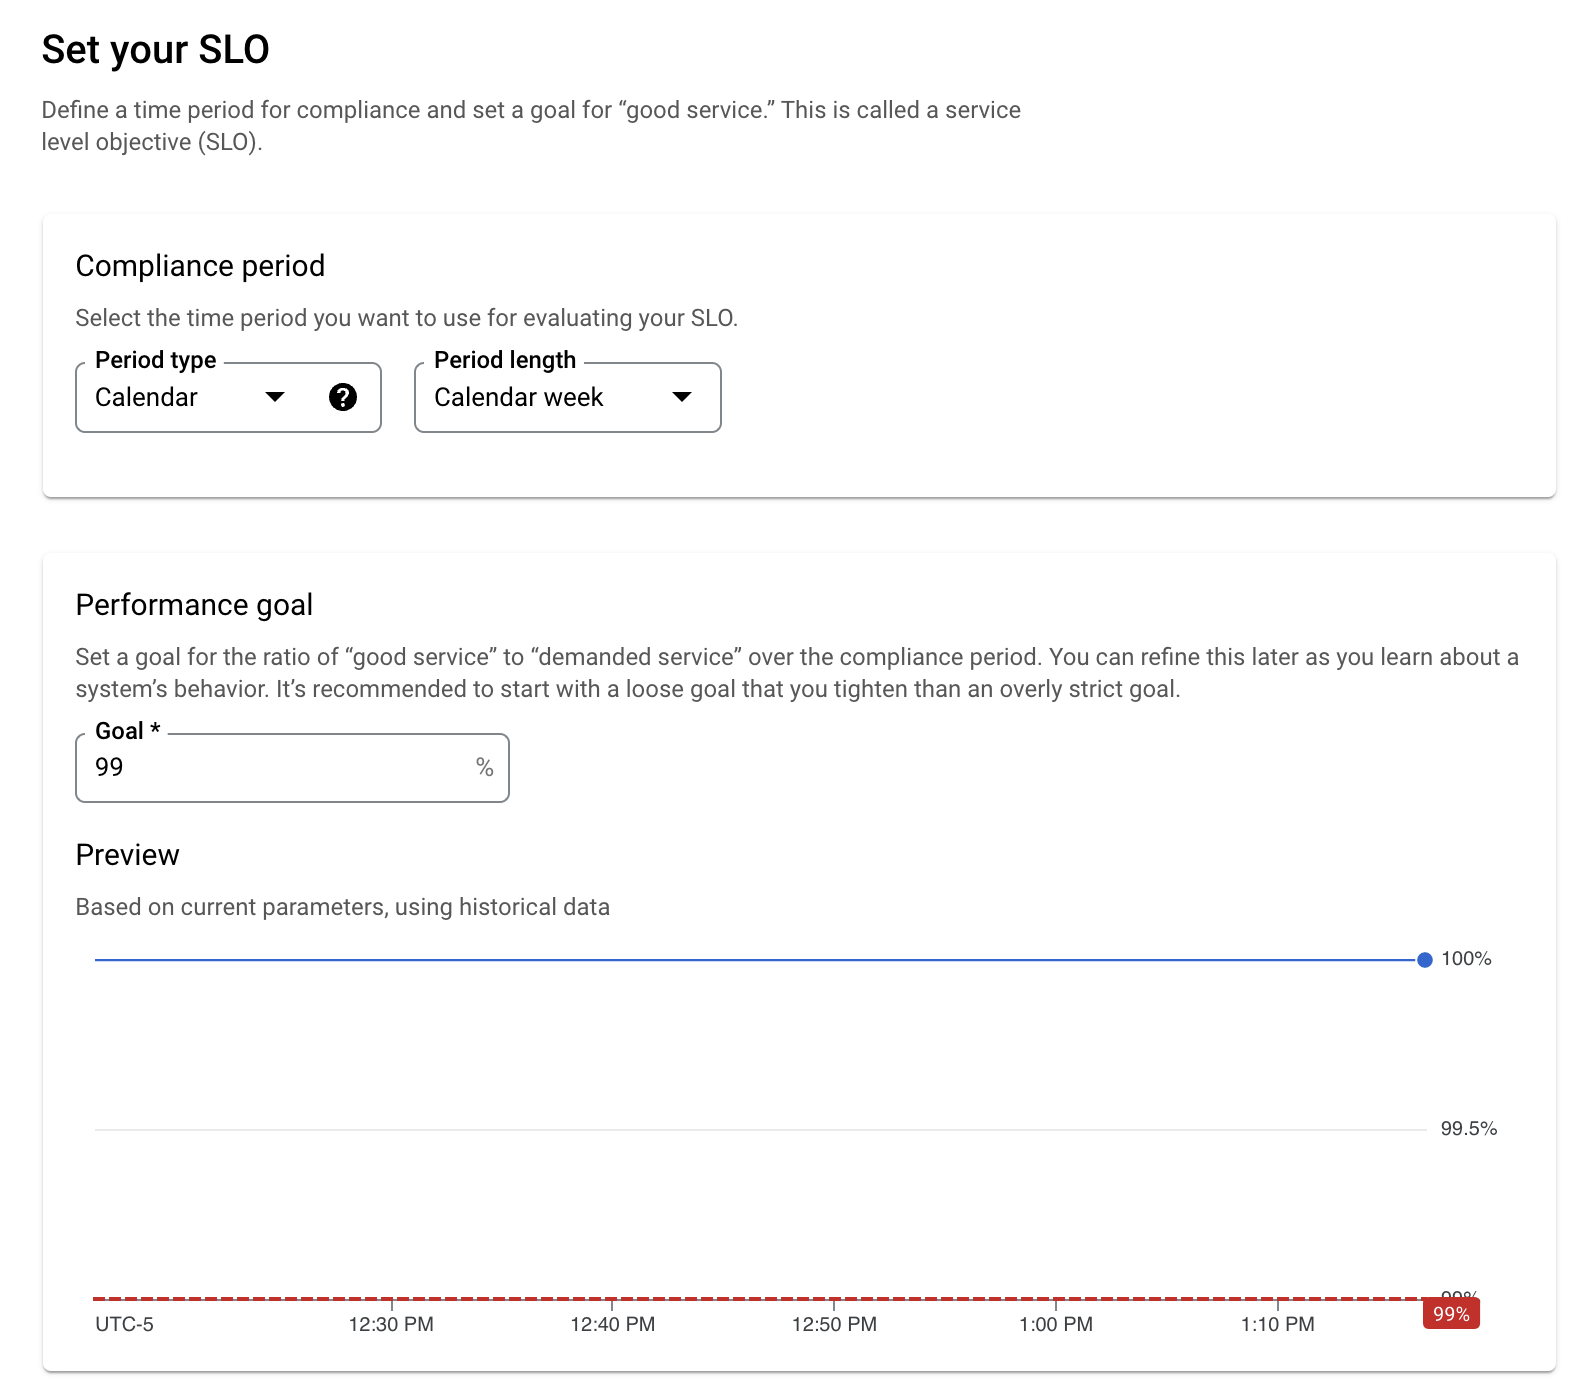
Set your SLO compliance period to a week, and set your performance target to 99%:
-
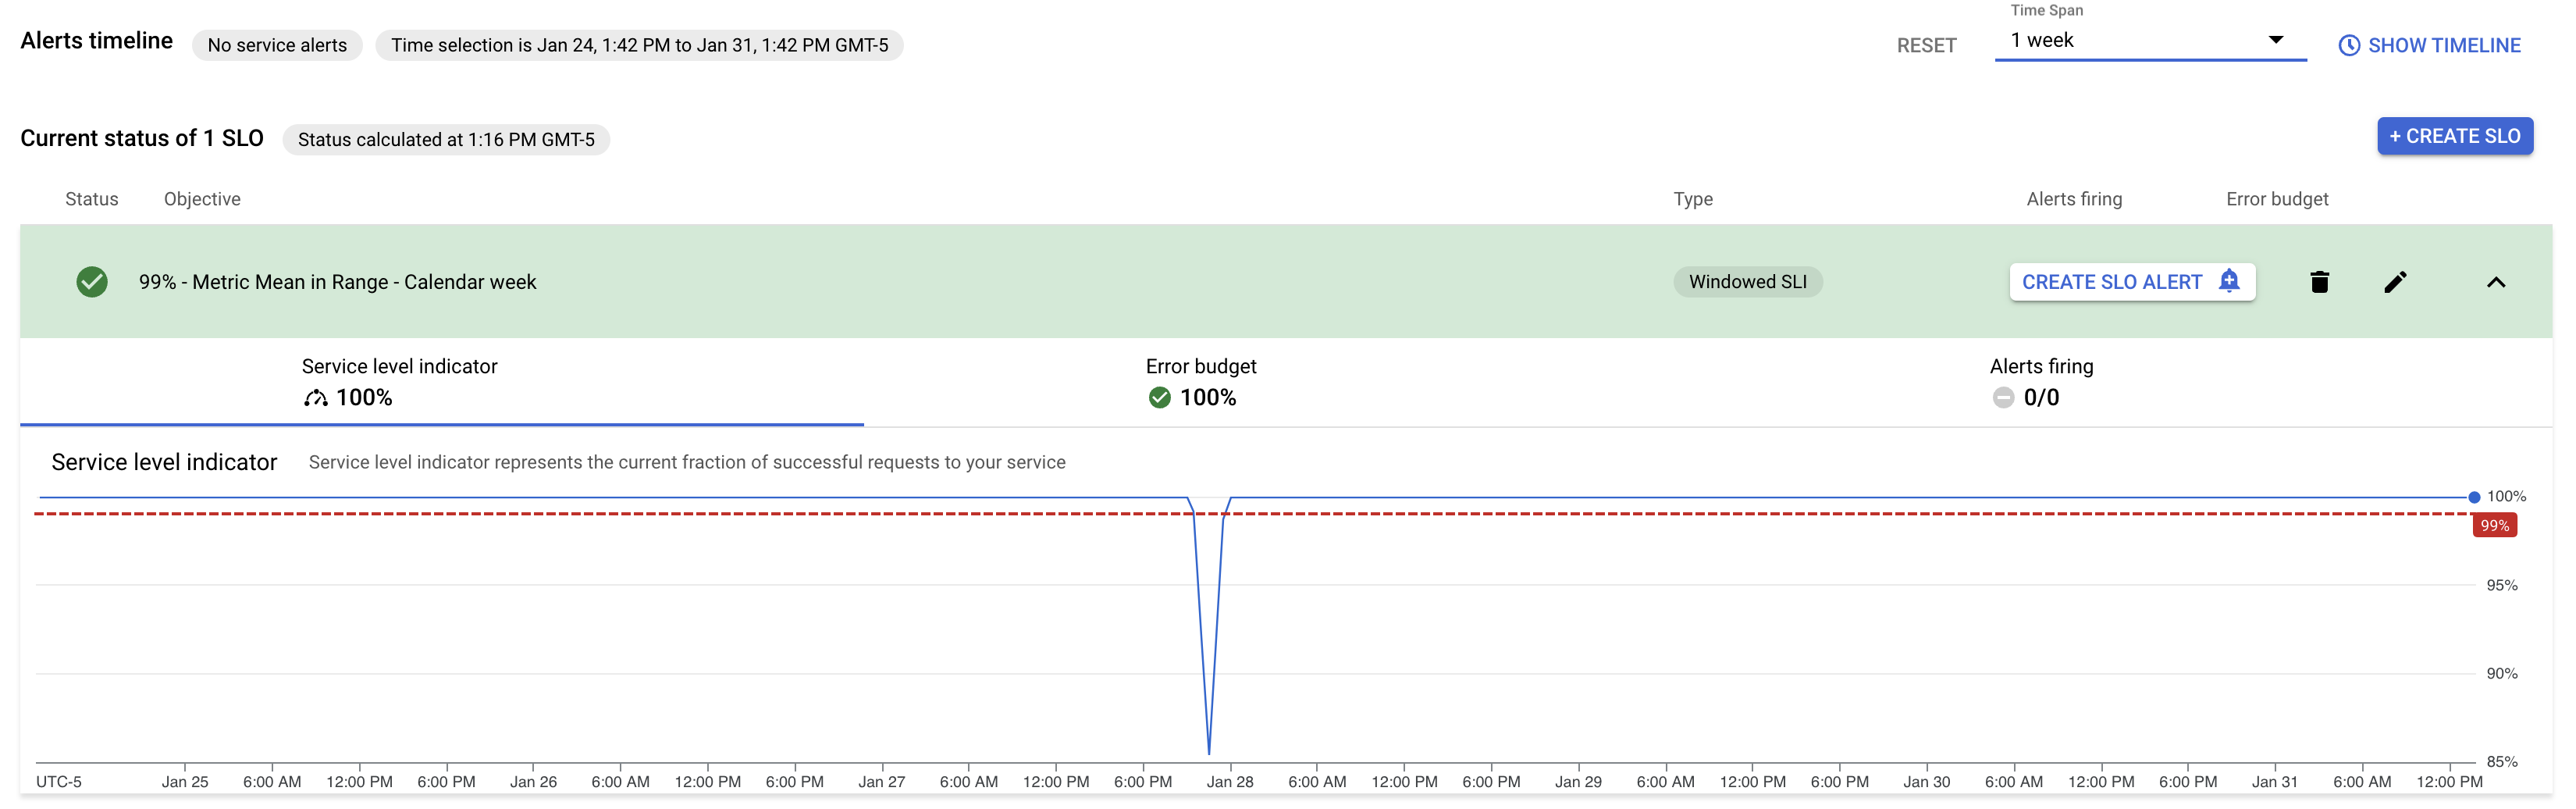
Review your SLO details and click the big friendly "Create SLO" button!
Et voila! You now have an active SLO, and you can see the state of your error budget and quickly zoom in on any time periods when you were not in compliance:
Step Three: Pat yourself on the back for implementing best SRE practices!
It's a good feeling, right? You can lord it over everyone at the next Kubernetes MeetUp. (Note: lording-over is not endorsed by Oden Technologies, and Oden Technologies takes no responsibility for the results.)
Step Four: If this sounded fun, come talk to us!
Admit it: you're the kind of oddball who read through all of this and thought "that sounds pretty neat!" (It's okay, so are we.) If you think getting to do fussy cloud-native devops/SRE work while helping people who wear hard hats and steel-toed boots do their job more effectively sounds like your cup of tea, you should definitely look at our careers page!