- Published on
How we do Passive Checks
- Authors

- Name
- Oden SRE Team
- @oden_tech
How we do Passive Checks at Oden
As the name and logo suggest, Oden offers our users an “all seeing eye” over their manufacturing.
When a cable manufacturer is creating too thin of cable, Oden sees it. When an injection moulder makes a short shot incompletely filling their mold cavity, Oden sees it. When an operator is running a line at a slower speed than the machines are capable of, Oden sees it.
Oden provides this oversight to deliver our all-consuming mission, to eliminate waste from manufacturing.
But that begs the question, what happens when Oden’s own systems fail? What happens when a nightly job doesn’t get scheduled or completed on time? Or when a critical reporting system stops sending its reports.
Who watches the watchmen?
This blog post will go over a straightforward tool Oden uses for internal monitoring, Passive Checks.
Regular Old “Active Checks”
Oden uses lots of “checks” to ensure our platform is running smoothly. Think of these checks as assertions that, whenever false, suggest we’re not meeting Service Level Objectives (SLOs). We escalate the issue as a “page” to an “on-call” engineer who then assesses and fixes it. And, much like our customers do in their plants, we are continuously evaluating and evolving this system with weekly on-call handoff meetings and post-mortems.
Most of our checks are “Active Checks.” Things that are true or false at the time we’re making the assertion. For example, “The 95th percentile of request time for this service should never exceed n milliseconds”.
These checks are easy to write because we can express them against existing monitoring time-series data. We host Oden on Google Cloud Platform (GCP) and track “request time” in Google Cloud Stackdriver Monitoring. And we use Stackdriver’s “Metric Threshold” condition triggers to define “95th percentile is greater than”.
Passive Checks
A “Passive Check” is a little trickier. It expresses that something stopped happening or when something was supposed to happen but hasn’t for a certain amount of time. A classic example is a cron job or Airflow DAG that backs up a database every hour. It’s hard to know precisely when it will finish because it doesn’t always take the same amount of time, but we know there’s an issue if it hasn’t happened for a certain period.
We’d like to assert:
The database has been backed up in the past two hours.
The first step to defining a Passive Check is to redefine it as an Active One:
The time the database was last backed up is less than now minus two hours.
Recording a Task Run in GCS
Our goal is to define a generic method of registering when some “task” last ran and how long it can go without running before it becomes an issue. To do this, we define a record structure which contains: What ran When it ran last How long to wait before this is an issue
We store this record in Google Cloud Storage (GCS). We will upsert this record to a key in the gs://<project_id>_monitoring/ bucket on completing the task.
Each record will map to a Stackdriver Custom Metric, which will track “how overdue this task is”.
The actual JSON record looks like this:
{
  "marked_time": <int32>, // when it ran
  "timeout": <int32>, // how long to wait
  "task_id": <string>, // what ran
  "location": <string>, // supporting info
  "namespace": <string> // supporting info
}
The "marked_time" and "timeout" fields are required. The remaining fields are optional and may be ignored or overwritten by downstream elements of the system. These fields are required labels for the Stackdriver generic task resource. The Stackdriver "job" label will be filled in from the basename of the GCS key minus the ".json" extension, e.g. "pg_export" in the above example. The "task_id" field should be filled in with a unique task identifier. The "location" field should be filled in with the GCP region and zone (e.g. "us-central1-a") that the DAG executes in. The "namespace" field should be a unique identifier (per project) for the Kubernetes cluster where the task is executing.
The value of the “marked_time” key is a 32bit signed integer (stored as INT64 in Stackdriver), representing a standard UNIX timestamp of seconds-since-the-epoch (e.g. the output of int(time.time()) or datetime.datetime.now().strftime('%s') in python). This represents the time from which we begin measuring the timeout: for example, when execution of the task is complete, or it could be the "intended" execution time. (Apache Airflow will use the latter via execution_date, but we intend this system to be extensible to non-airflow systems which do not have a concept of "intended" execution time.)
The value of the “timeout” key is a 32bit signed integer, representing the number of seconds that can elapse before the task is considerer to be “too late”. This value should be set as a property of the individual DAG, as different DAGs may have different execution schedules.
Cloud Function and Stackdriver Custom Metric
To turn these records into actual alerts we use two things: A Stackdriver Custom Metric which monitors for “overdue_seconds” across many labels. A scheduled Google Cloud Function which updates this metric with the seconds a particular task is overdue where the task_id is the label.
The Stackdriver metric looks like this:
custom.googleapis.com/passive_checks/tasks/overdue_seconds, with a single dimension (label) of “task_id”:
{
  "name": "",
  "description": "Number of seconds we are overdue for a task execution.",
  "displayName": "Task Overdue",
  "type": "custom.googleapis.com/passive_checks/tasks/overdue_seconds",
  "metricKind": "GAUGE",
  "valueType": "INT64",
  "unit": "s"
}
To translate these GCS objects into Stackdriver alerts, we use a Google Cloud Function invoked once a minute by Google Cloud Scheduler. This function will:
- Parse the JSON document and compute the overdue_seconds metric for the DAG:
max(0, (<now> - <completed_time> - <timeout>))
- Post that value to the custom Stackdriver metric (above), with the "job" label filled in with the name of the DAG (ie the final element of the GCS key name, stripped of the '.json' file extension). The optional labels, if present in the JSON, will be filled in as well; otherwise they will be left as empty strings.
Finally, we create a condition on our custom metric to alert us whenever an "overdue" label and value are greater than zero. We actually add a little extra buffer here by saying it needs to be more than 300s overdue for at least 600s.
The configuration looks like this:
{
  "conditionThreshold": {
    "aggregations": [
      {
        "alignmentPeriod": "60s",
        "groupByFields": ["resource.label.job"],
        "perSeriesAligner": "ALIGN_MEAN"
      }
    ],
    "comparison": "COMPARISON_GT",
    "duration": "600s",
    "filter": "metric.type=\"custom.googleapis.com/oden/passive_checks/tasks//overdue_seconds\"",
    "thresholdValue": 300,
    "trigger": {
      "count": 1
    }
  },
  "displayName": "passive check overdue (qa)",
  "name": "projects/oden-qa/alertPolicies/2152300142068522021/conditions/2152300142068521054"
}
Finally, if you'd like to implement this yourself, here's the full soruce of our cloudfunction.
#!/usr/bin/env python3

import json
import os
import sys
import time
import logging

import google.api_core
from google.cloud import error_reporting
from google.cloud import storage
from google.cloud import monitoring_v3

METRIC = "custom.googleapis.com/oden/passive_check/overdue_seconds"
RESOURCE_TYPE = "generic_task"
ERR = error_reporting.Client()
PROJECT_ID = os.getenv("PROJECT_ID", os.getenv("GCP_PROJECT"))
FUNCTION_REGION = os.getenv("FUNCTION_REGION", "unset")
FILE_SUFFIX = ".json"

logging.basicConfig(format="%(levelname)s: %(message)s", level=logging.INFO)


if not PROJECT_ID:
    logging.fatal("PROJECT_ID unset")


def get_checks(bucket):
    checks = []
    blobs = bucket.list_blobs()
    for page in blobs.pages:
        for blob in page:
            if blob.name.endswith(FILE_SUFFIX):
                # strip off '.json'
                try:
                    check_service, check_type, check_file = blob.name.split("/")
                except ValueError:
                    logging.error(f"non-conforming GCS object: {blob.name}")
                    continue
                check_name = check_file[0 : -len(FILE_SUFFIX)]
                try:
                    check_data = json.loads(
                        blob.download_as_text(if_generation_not_match=0)
                    )
                except google.api_core.exceptions.NotFound as ex:
                    # implicitly there's a race between list_blobs and download_as
                    logging.error(f"Could not fetch {blob.name}: {ex}")
                    continue
                except json.decoder.JSONDecodeError as ex:
                    logging.error(f"Could not decode {blob.name}: {ex}")
                    continue
                except Exception as ex:
                    logging.error(f"Could not fetch {blob.name}: {ex}")
                    ERR.report_exception()
                    continue
                checks.append(
                    {
                        "name": check_name,
                        "service": check_service,  # e.g. kubernetes, airflow
                        "type": check_type,  # e.g. cronjob, dag
                        "data": check_data,
                    }
                )
    return checks


def post_metric(mon_client, project_name, labels, completed, timeout):
    now = time.time()
    seconds = int(now)
    elapsed = seconds - completed
    overdue = max(0, elapsed - timeout)
    logging.info(
        f"INFO: service {labels['namespace']} task {labels['job']} is {overdue} seconds overdue."
    )
    series = monitoring_v3.types.TimeSeries()
    series.metric.type = METRIC
    series.resource.type = RESOURCE_TYPE
    series.resource.labels.update(labels)

    nanos = int((now - seconds) * 10 ** 9)
    interval = monitoring_v3.TimeInterval(
        {"end_time": {"seconds": seconds, "nanos": nanos}}
    )
    point = monitoring_v3.Point(
        {"interval": interval, "value": {"int64_value": overdue}}
    )
    series.points = [point]

    if os.getenv("DRY_RUN") == "true":
        logging.info("Would post metric: %s" % series)
        return
    try:
        mon_client.create_time_series(
            request={"name": project_name, "time_series": [series]}
        )
    except Exception as ex:
        logging.error("Error: could not update stackdriver: %s" % ex)
        ERR.report_exception()
        pass


def assemble_labels(check):
    labels = {}
    labels["project_id"] = PROJECT_ID
    # we put the service and namespace into the namespace label
    # e.g. kubernetes/services-1 or airflow/oden-workflows-1
    labels["namespace"] = "/".join(
        [check["service"], check["data"].get("namespace", "unset")]
    )
    # we put the check_type and the job name into the job label
    # e.g. cronjobs/elasticsearch-backup or dags/alerts-v1
    labels["job"] = "/".join([check["type"], check["name"]])
    labels["location"] = check["data"].get("location", FUNCTION_REGION)
    labels["task_id"] = check["data"].get("task_id", "unset")
    return labels


def eval_check_timeouts(checks):
    mon_client = monitoring_v3.MetricServiceClient()
    project_name = mon_client.common_project_path(PROJECT_ID)

    for check in checks:
        timeout = check["data"].get("timeout")
        completed = check["data"].get("marked_time")
        if timeout is None or completed is None:
            logging.error(
                f"Invalid json doc for check {check['name']}: {check['data']}"
            )
            continue
        labels = assemble_labels(check)
        post_metric(mon_client, project_name, labels, completed, timeout)


def passive_check_overdue_monitor(data, context):
    logging.debug(f"Data: {data}")
    logging.debug(f"Context: {context}")

    if not PROJECT_ID:
        raise Exception("no PROJECT_ID or GCP_PROJECT found in process env")

    bucket_name = PROJECT_ID + "_monitoring"
    logging.info(f"Bucket: {bucket_name}")

    gcs_client = storage.Client()
    bucket = gcs_client.get_bucket(bucket_name)

    checks = get_checks(bucket)

    if len(checks) < 1:
        logging.info(f"No check info files found at gs://{bucket_name}")
        logging.info("Exiting")
        sys.exit(0)

    eval_check_timeouts(checks)
    logging.info("All done! ✨ 🍰 ✨")


def cloud_function(data, context):
    return passive_check_overdue_monitor(data, context)


if __name__ == "__main__":
    passive_check_overdue_monitor(None, None)
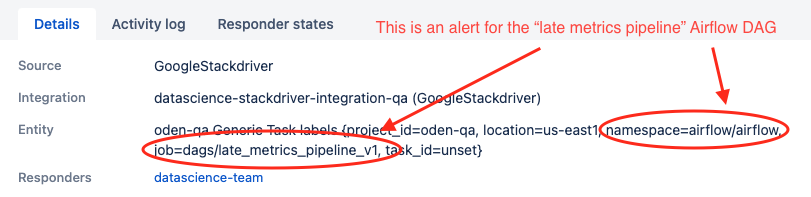
Finally, like all of our Stackdriver conditions, when one of these metric labels shows up as “overdue” we escalate the alert to our paging system, Opsgenie. By leveraging the namespacing we can even escalate our issues to the specific on-call team rotations.
In summary
Today, we have dozens of Passive Checks that monitor Oden. They oversee everything from non-user-visible backups to email reports that our users expect to read with their first cup of coffee as they start their day. It's not everything that Oden does to keep the all seeing eye all seeing, but it's a powerful piece of the puzzle.